How to Calculate the Right Volume for Your Bar
French psychologist Nicolas Guéguen proved this question could be costing you 30% in unrealized revenue 4 min read
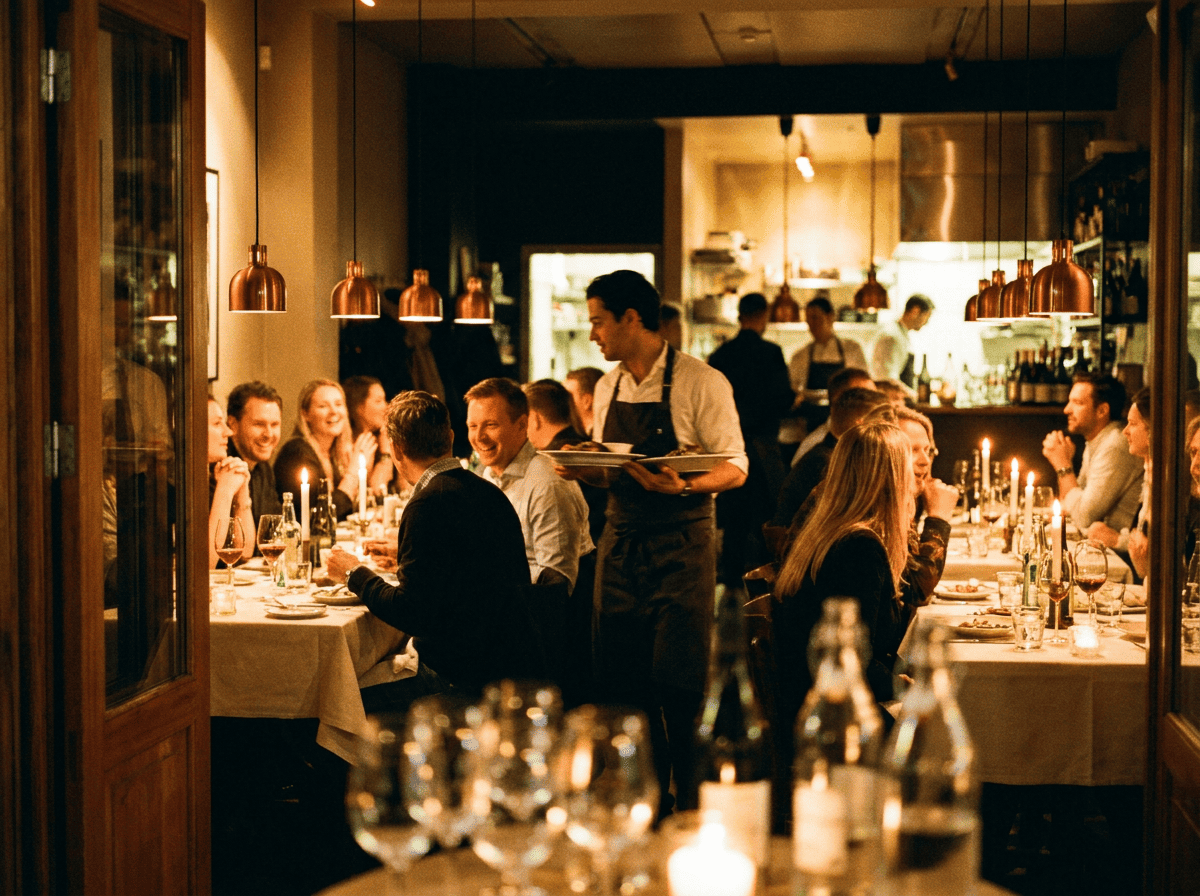
2004. Two identical bars: similar audience, music, drinks. One difference — volume. 72 dB in one, the level of a loud conversation or a vacuum cleaner. 88 dB in the other, the sound of busy road traffic during rush hour. In the louder environment, guests drained their glasses three minutes faster and ordered more often.
In 2008, Guéguen repeated the experiment with tighter methodology: three Saturday evenings, forty guests, same bars, same staff, same music — only the volume changed randomly between evenings.
- What they recorded
- How it works
- The question Guéguen raised himself
- How to work with this
- Conclusion
- What the research says
- FAQ
What they recorded
| 72 dB | 88 dB | |
| Average number of drinks | 2.6 | 3.4 |
| Time per drink | 14.5 min | 11.5 min |
30% difference in drink orders. 20% in consumption speed.
Translated to an hourly rate: at 72 dB, a guest drinks around 4.1 glasses per hour (60 min / 14.5 min); at 88 dB, around 5.2 (60 min / 11.5 min). The gap is 1.1 drinks per guest per hour. Over an evening, that works out to +0.8 drinks per average order. Across 50 guests, 40 additional line items on the register.
How it works
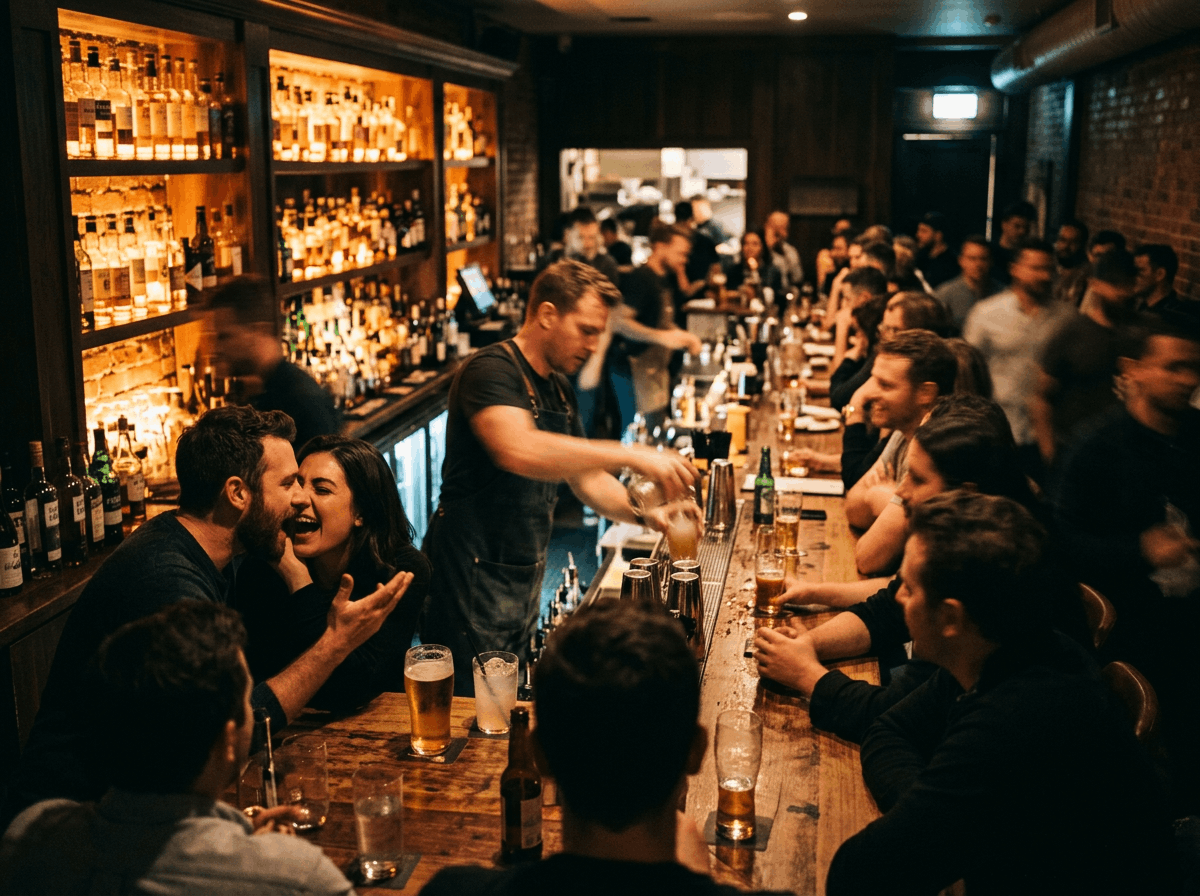
Guéguen explained the mechanism this way. Loud music makes conversation difficult: people lean in, ask each other to repeat, raise their voices — and in the pauses between attempts to talk, a hand reaches for the glass, without any conscious decision behind it.
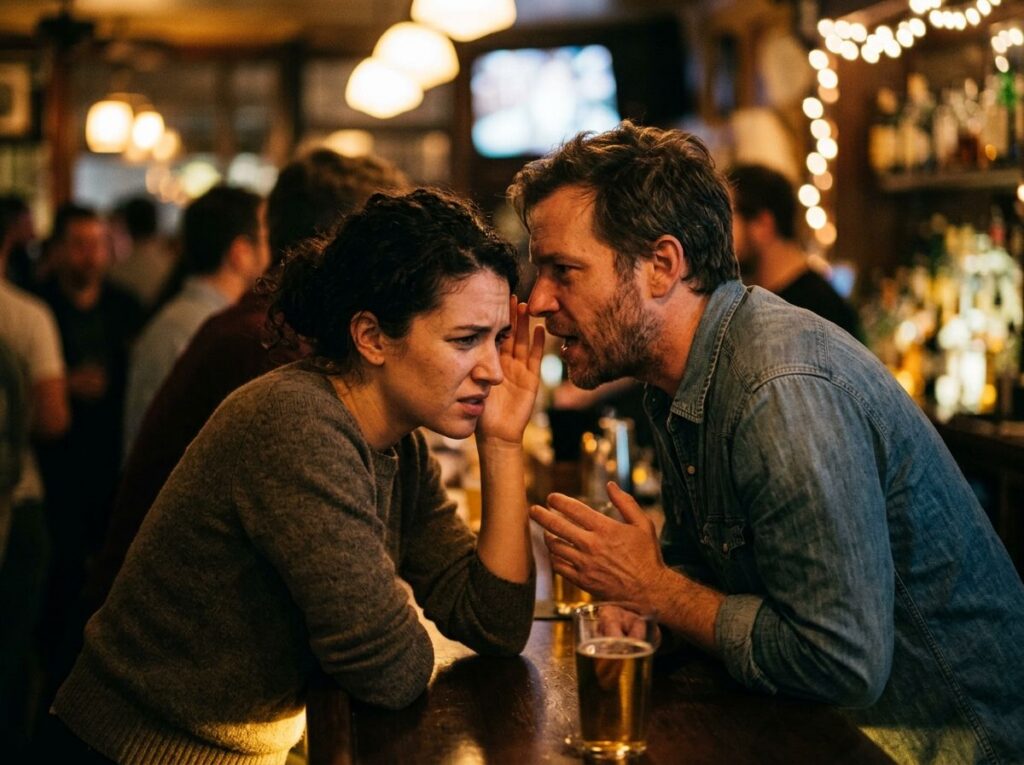
Physiology adds its part: elevated sound levels activate the nervous system, reduce inhibition, make the next order slightly less deliberate. The combined result of both mechanisms: plus 0.8 drinks per guest per evening.
The question Guéguen raised himself
In both papers, he wrote directly:
This data can be used to increase alcohol consumption — and framed it as a choice each person makes for themselves.
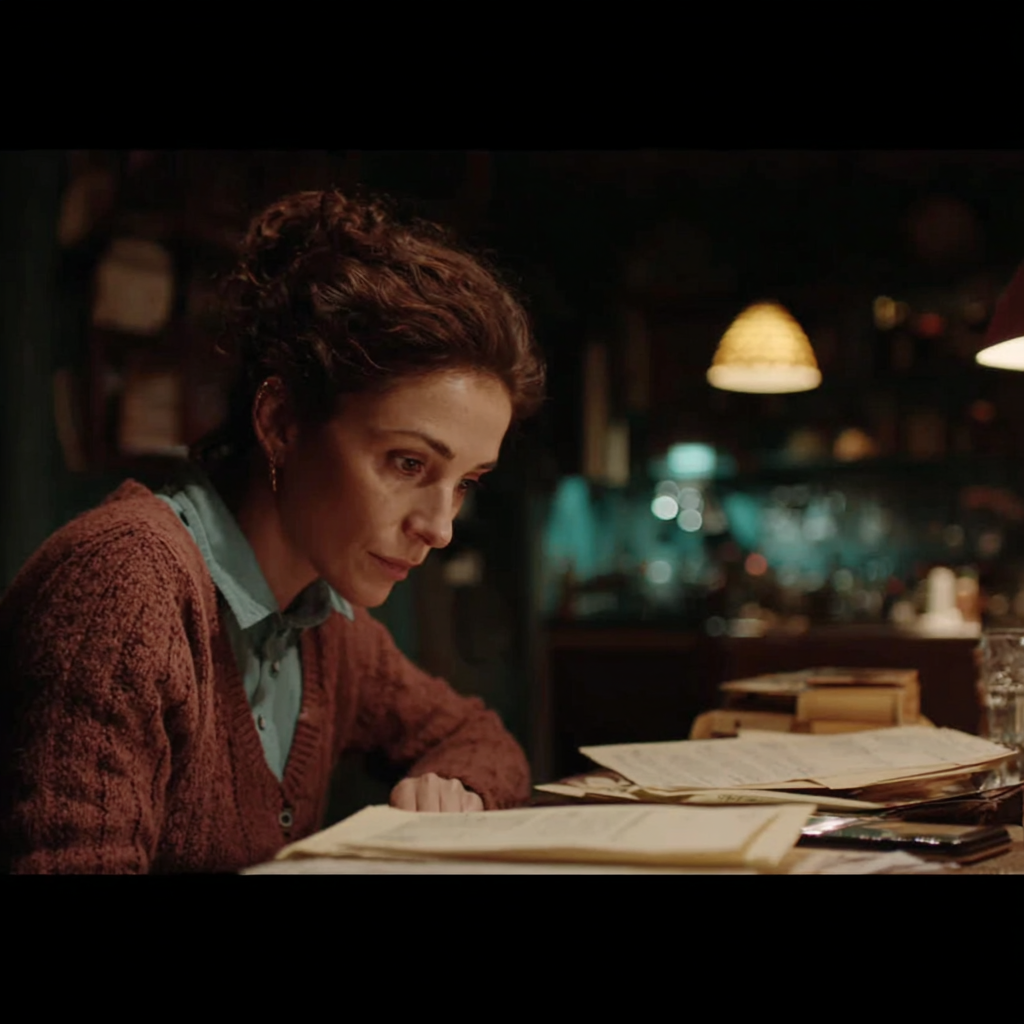
Most bars don’t think in decibels. Someone turned it up because the vibe felt flat, someone turned it down after a complaint. The venue’s audio policy takes shape around the mood of whoever’s on shift. Guéguen just gave it a number.
How to work with this
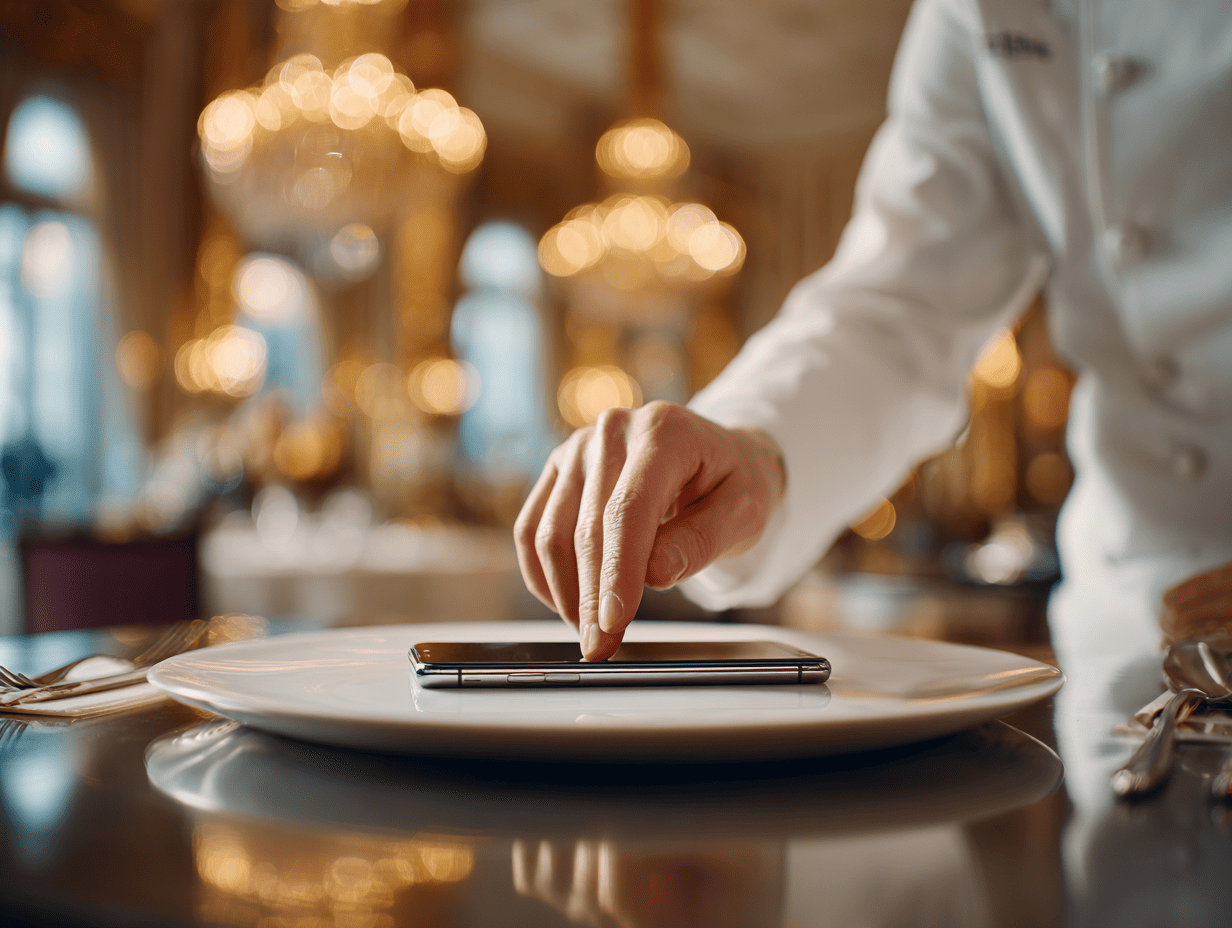
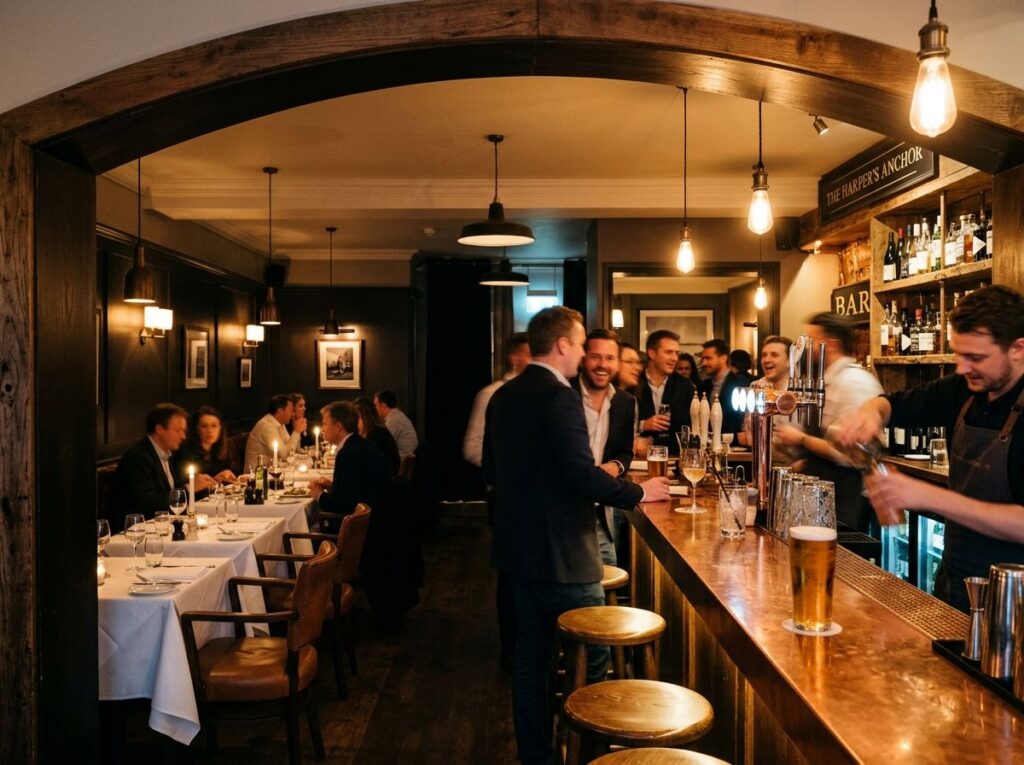
The waiting area and main dining room sit comfortably at 65–70 dB — the level where music is present without pressing down on conversation. The bar counter and lounge take 72–78 dB: enough to generate energy in the space while people can still hear each other. Everything above that is already the territory Guéguen described in his research.
Time of day follows the same logic. The lunch crowd came to eat and get back to work; the evening crowd has nowhere to be. The same volume serves them differently, and most venues sense this intuitively — they just don’t encode it as a fixed parameter.
Another variable: zoning. Terraces scatter sound, so they need a higher source level. Enclosed rooms with hard surfaces amplify it — less source achieves the same effect. The bar and the main dining room within a single venue almost always need different settings.
Conclusion
Guéguen described an environment restaurateurs are already creating — usually without thinking about it. Volume in the room affects guest behavior, and the only thing that varies from venue to venue is how deliberately that effect is managed.
Moodby lets you set music parameters by zone in advance. What plays in the room is configured once — and holds regardless of who’s working tonight.
What the research says
According to Nicolas Guéguen, Henri Le Guellec, and Céline Jacob, published in Perceptual and Motor Skills (2004), raising background volume in a bar increased the number of drinks ordered — the effect was recorded under field conditions with real guests.
According to Nicolas Guéguen, Céline Jacob, Henri Le Guellec, Thierry Morineau, and Marcel Lourel, published in Alcoholism: Clinical and Experimental Research (2008), raising volume from 72 to 88 dB increased average drink orders from 2.6 to 3.4 — a roughly 30% increase. Time per drink dropped from 14.5 to 11.5 minutes. Translated to an hourly rate: 4.1 drinks at 72 dB versus 5.2 at 88 dB — a difference of 1.1 drinks per guest per hour.
FAQ
How does music volume affect alcohol consumption? According to two field experiments by Nicolas Guéguen (2004, 2008), raising volume from 72 to 88 dB increased average drink orders from 2.6 to 3.4 — roughly 30%. Translated to an hourly rate: 4.1 drinks at 72 dB versus 5.2 at 88 dB. The mechanism: loud music makes conversation difficult, pauses fill with orders; elevated sound levels also reduce inhibition and increase impulse behavior.
What’s the optimal volume level for a restaurant? For areas where conversational comfort matters — the main dining room, waiting area — around 65–70 dB. Bar zones and lounges can take 72–78 dB. Above that is a deliberate choice with the behavioral consequences Guéguen documented in his research.
Does volume affect consumption speed? Yes. In the 2008 experiment, guests at 88 dB spent an average of 11.5 minutes per drink versus 14.5 minutes at 72 dB — roughly 20% faster. Theoretical hourly rate: 4.1 drinks at lower volume, 5.2 at higher.
Should you set different volume levels for different zones? Yes. Open spaces scatter sound — they need a higher source level. Enclosed rooms with hard surfaces amplify it — less source achieves the same effect. The bar counter and the main dining room within a single venue almost always need different settings.